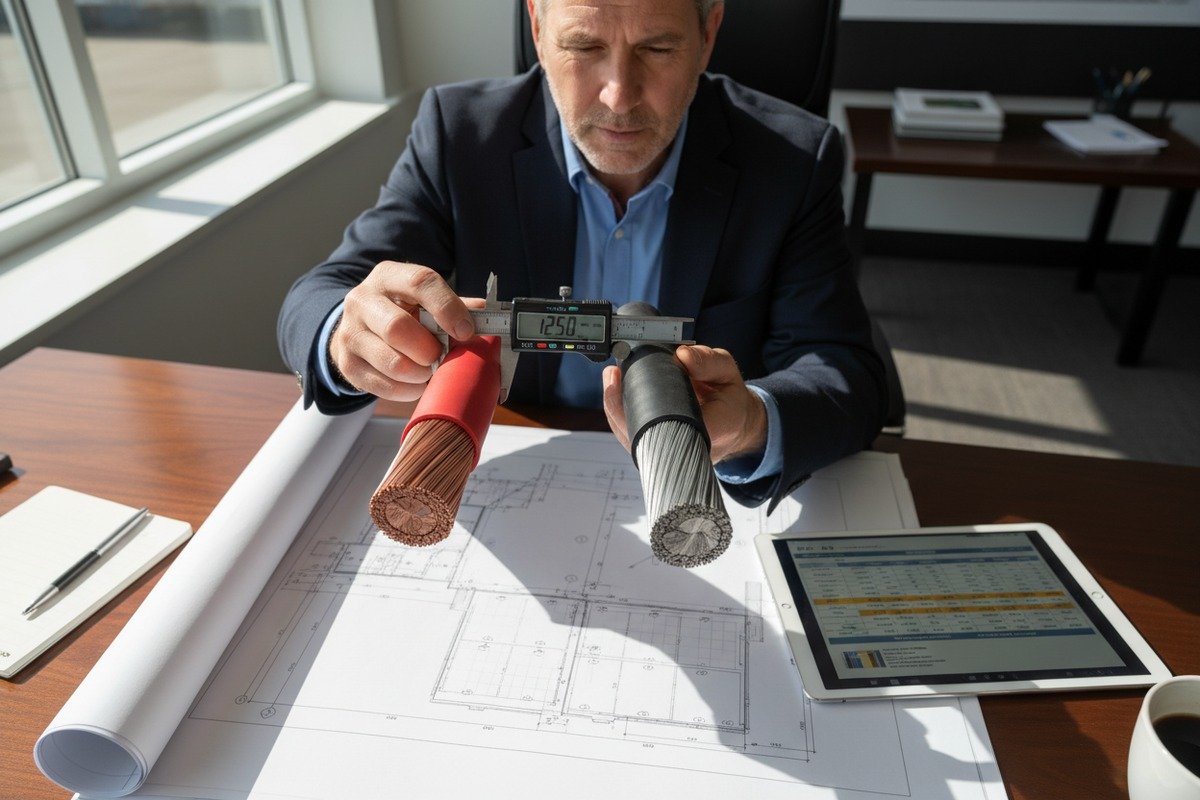
Every year, our quality team reviews dozens of UV test reports from raw material suppliers and independent labs. The numbers on paper don't always match what happens on a rooftop in Dubai or a solar farm in southern Spain after five years of relentless sun.
To verify UV resistance test data reliability for solar PV cables, request third-party certified test reports from accredited labs (TUV, UL), cross-check results against EN 50618 or IEC 62930 standards, confirm material formulation details including UV stabilizers, and validate certificates through the issuing body's online database.
This guide walks you through the exact steps, red flags, and standards you need to know. Whether you are an EPC project manager in Germany or a distributor sourcing from China, this will help you separate trustworthy data from marketing noise.
Which specific TUV or EN 50618 test reports should I request to confirm UV stability?
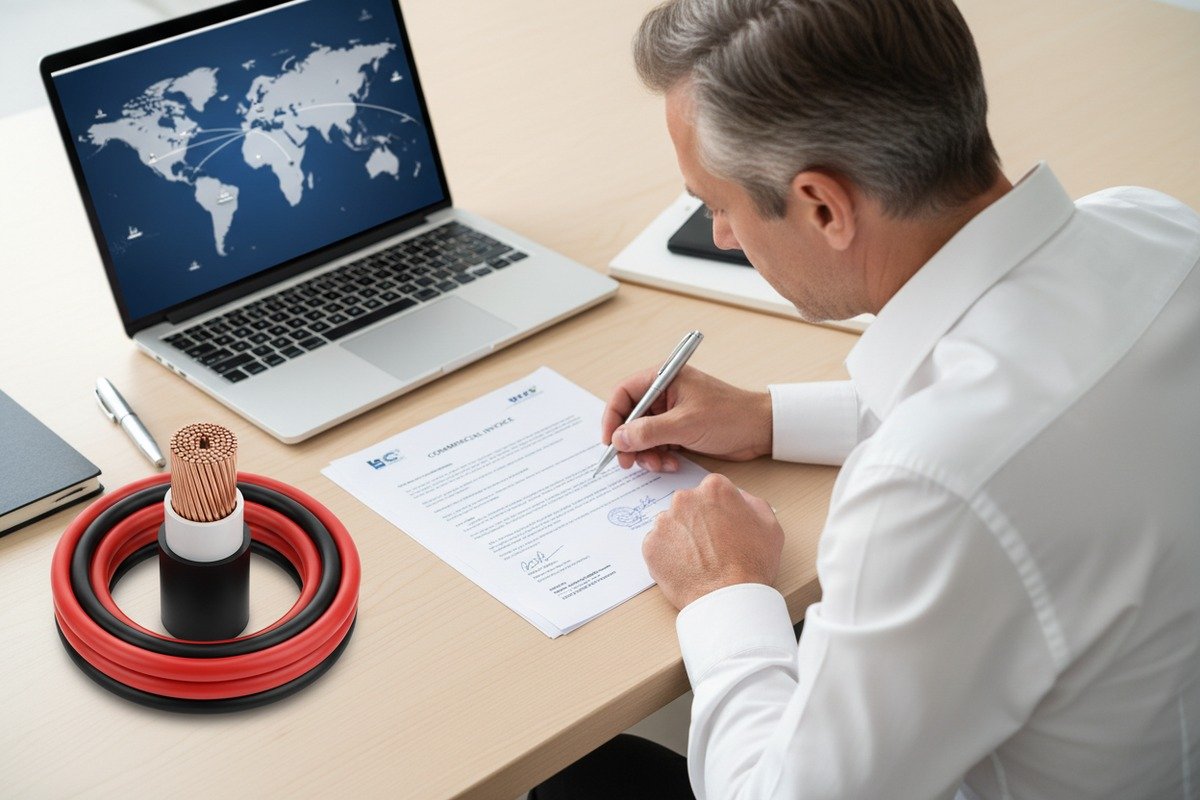
When we prepare shipment documentation for European EPC clients, the first question we get is always about certificates. But not all test reports carry the same weight, and knowing which ones to ask for makes a real difference.
You should request the full TUV 2PFG 1169 or EN 50618 type test report that includes UV aging results per ISO 4892-2 or ISO 4892-3, showing pre- and post-exposure mechanical property data, test duration of at least 720 hours, and the specific irradiance level used during testing.

Understanding the Key Standards
Several overlapping standards govern UV testing for solar PV cables 1. Each one addresses UV resistance slightly differently. Here is a breakdown:
| Standard | Scope | UV Test Method | Minimum Test Duration |
|---|---|---|---|
| EN 50618 2 | European PV cable standard | ISO 4892-2 (Xenon arc) | 720 hours |
| TUV 2PFG 1169 | TUV-specific PV cable approval | ISO 4892-2 3 or ISO 4892-3 | 720 hours |
| UL 4703 | North American PV wire | UL 746C / ASTM G154 | 720 hours |
| IEC 62930 | International PV cable standard | ISO 4892-2 | 720 hours |
What Should Be Inside the Report
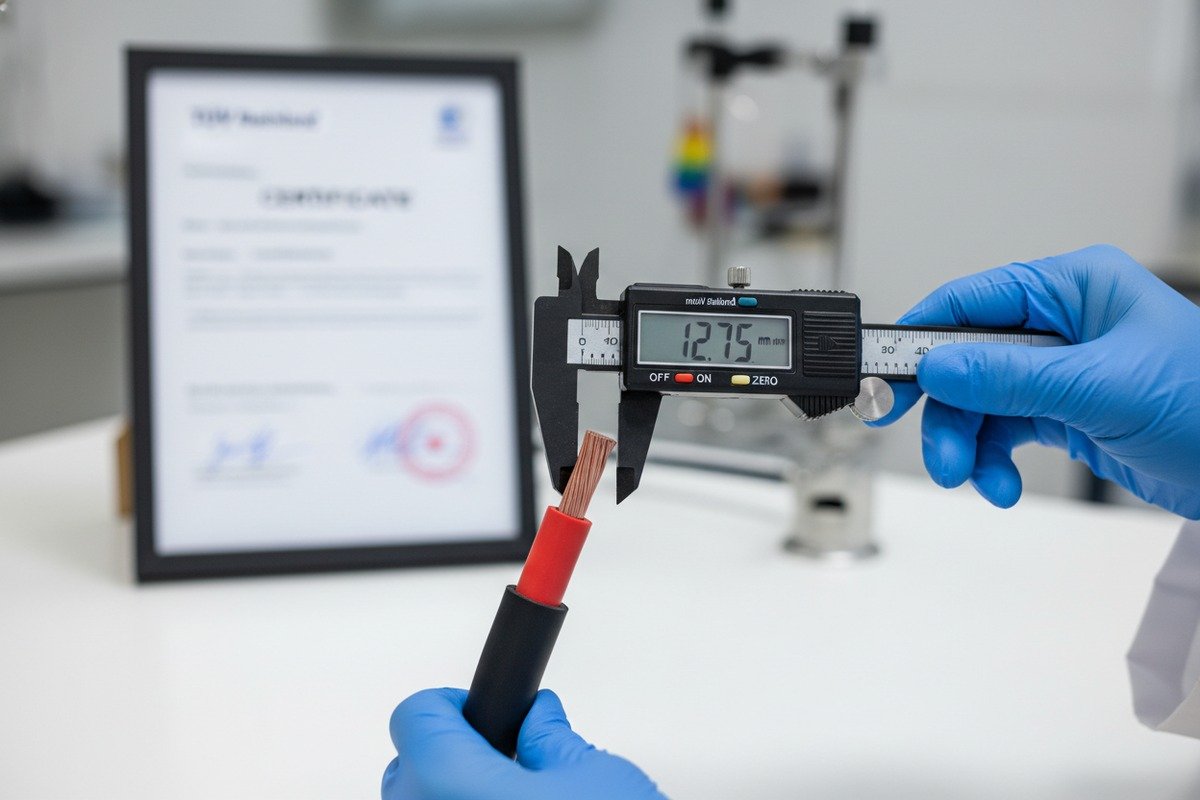
A proper test report is more than a pass/fail stamp. You want to see the actual numbers. Look for tensile strength retention and elongation at break 4, both before and after UV exposure. EN 50618 typically requires that elongation at break remains above 50% of its original value after aging.
The report should also specify the irradiance level. For xenon arc tests under ISO 4892-2, the standard irradiance is 60 W/m² in the 300–400 nm range. If the report uses a different value, the results may not be comparable.
How to Validate the Certificate
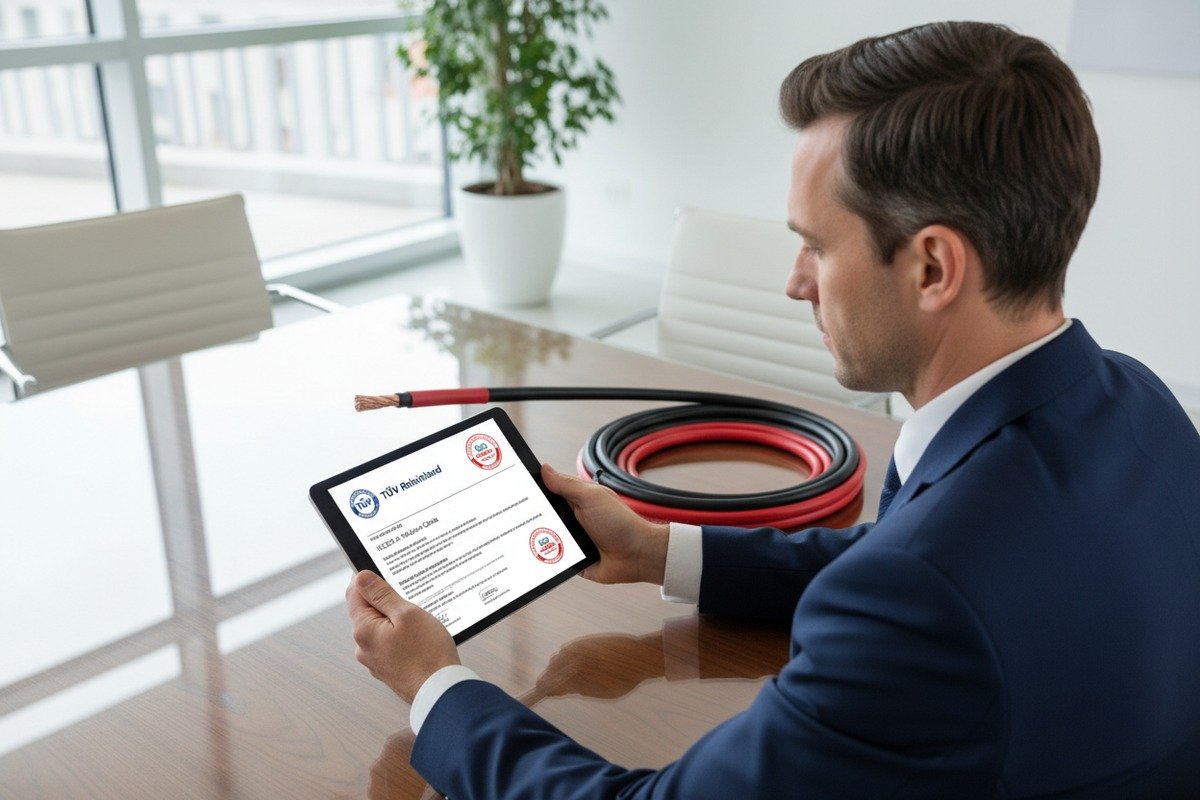
Every TUV certificate has a unique ID number. Go to the TUV Rheinland CERTIPEDIA database 5 or the TUV SUD certification portal. Enter the certificate number. Confirm the cable model, the manufacturer name, and the expiry date. We have seen cases where buyers received certificates that were expired or issued for a different cable model entirely. This simple step takes five minutes and can prevent serious problems.
Also check whether the certificate covers the full cable construction or only the raw material. A material-level certificate does not guarantee the finished cable meets the standard.
How can I tell if the XLPO insulation material will actually withstand decades of intense sun exposure?
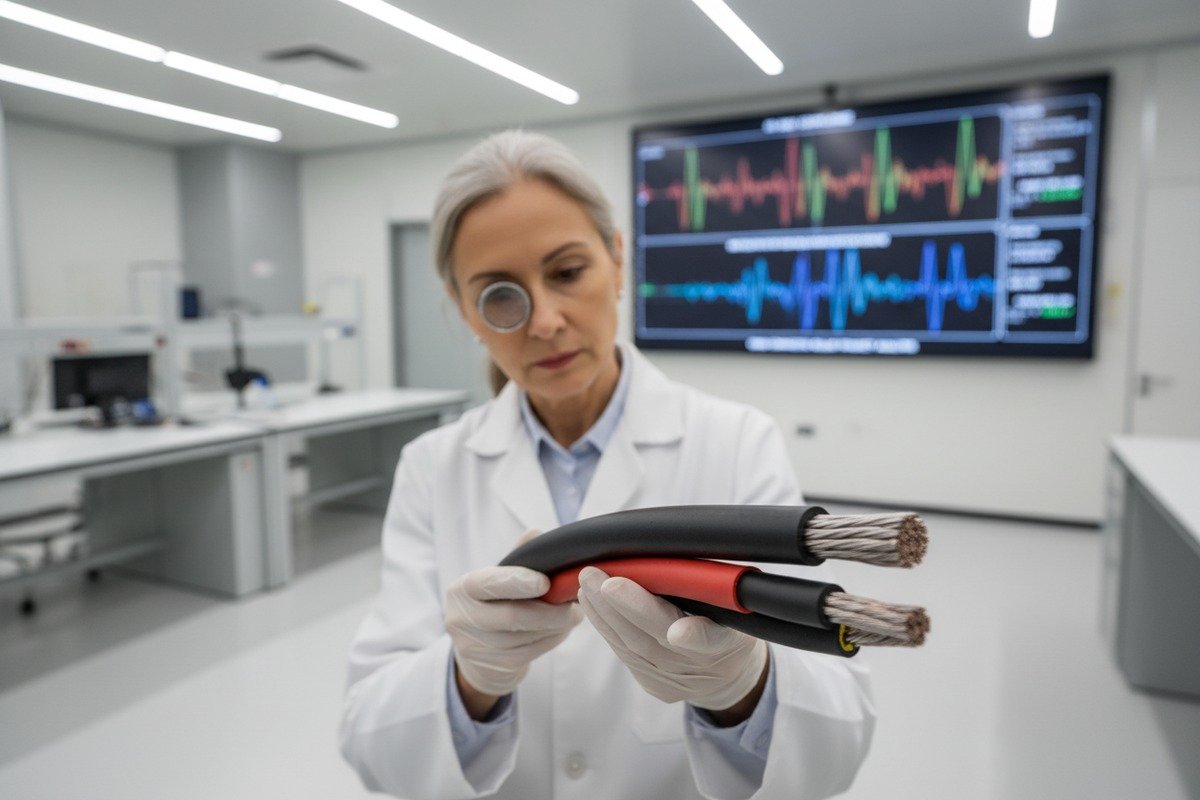
Our engineers spend considerable time selecting and testing XLPO compounds before they ever reach the extrusion line. XLPO insulation material 6 The difference between a good XLPO formulation and a mediocre one is invisible to the naked eye—but it shows up dramatically after a few years outdoors.
Reliable XLPO insulation uses cross-linked polyolefin compounded with effective UV stabilizers like HALS and carbon black. Verify this by reviewing the material data sheet, requesting FTIR analysis results, and confirming that post-aging elongation at break exceeds 50% after 720+ hours of accelerated weathering.

Why XLPO Matters for Long-Term UV Performance
XLPO (cross-linked polyolefin) is the dominant insulation material for modern solar PV cables because of its excellent balance of thermal resistance, flexibility, and chemical stability. But "XLPO" is a broad category. The actual UV performance depends heavily on the specific additives blended into the base polymer.
Carbon black 7 is the most effective UV absorber for cable compounds. At concentrations of 2.5–3% by weight, it blocks nearly all UV radiation from penetrating the polymer matrix. For colored insulation (red or blue cores), manufacturers use hindered amine light stabilizers (HALS) and UV absorbers like benzotriazole derivatives instead.
Key Material Properties to Check
| Property | Good XLPO Compound | Poor XLPO Compound |
|---|---|---|
| Carbon black content (jacket) | 2.5–3.0% | <2.0% or unevenly dispersed |
| HALS stabilizer present | Yes | No or minimal |
| Elongation at break (pre-aging) | >300% | <200% |
| Elongation retention after 720h UV | >70% | <50% |
| Cross-linking degree | >65% (gel content) | <60% |
Advanced Verification: FTIR and SEM
If you manage large-scale projects and need extra confidence, you can send cable samples to an independent lab for Fourier-transform infrared spectroscopy 8 (FTIR). This technique identifies the chemical bonds in the insulation material. After UV aging, FTIR can detect carbonyl group formation—a clear sign of photo-oxidative degradation. A cable with good UV stabilizers will show minimal carbonyl index increase.
Scanning electron microscopy (SEM) reveals micro-cracking on the surface that is invisible to the human eye. Even minor surface cracks accelerate moisture ingress and further degradation. We recommend SEM analysis for any project in high-UV regions like the Middle East, North Africa, or equatorial zones.
Real-World Correlation
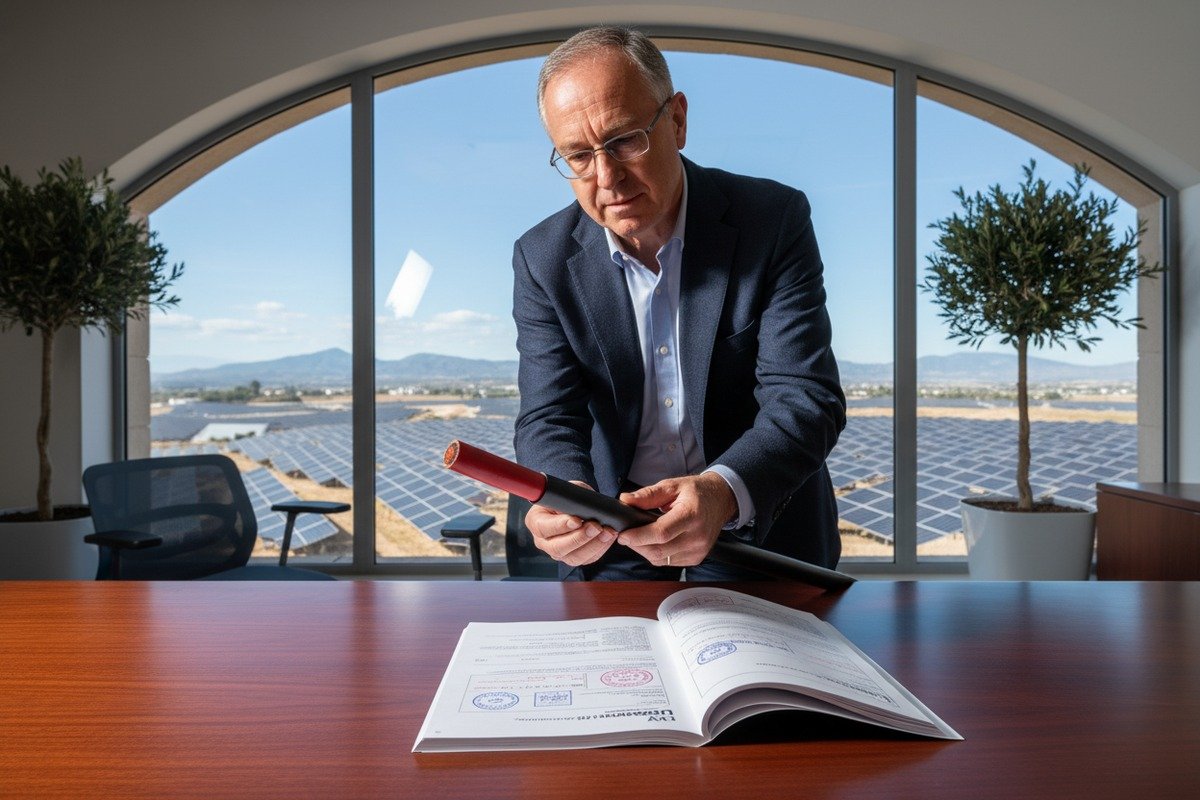
Lab tests simulate aging. But the real proof comes from field performance. Ask your supplier for field installation references in similar climatic conditions. If a cable has been deployed in a solar farm in southern Spain or Arizona for five or more years without visible degradation, that is strong supporting evidence. Lab data and field data together give you the most complete picture.
What red flags should I look for in a manufacturer's internal UV resistance test data?
Over the years, our export team has reviewed competitor test reports alongside our own when clients bring them for comparison. Some patterns immediately signal unreliable data, and recognizing them early saves time and money.
Red flags include test durations below 720 hours, missing pre-exposure baseline data, claims of zero degradation, absence of accredited lab identification, vague test method references, and reports that show no temperature or humidity control parameters during the UV aging process.

The Most Common Warning Signs
Let's break down the specific red flags you should watch for when reviewing a manufacturer's internal UV resistance data.
No accredited lab involvement. If the test was conducted entirely in-house without any third-party oversight, the data lacks independent verification. Internal labs may not follow standardized calibration schedules or testing protocols. This does not mean internal data is always wrong—but it should be treated as preliminary, not conclusive.
Unrealistically perfect results. UV exposure always causes some degree of property change. If a report shows 0% degradation in tensile strength and elongation after 1000 hours of xenon arc exposure, that is either a measurement error or a fabrication. Even premium XLPO compounds show 5–15% property changes after extended UV aging.
Short test duration. The minimum industry benchmark is 720 hours. Some manufacturers test for only 200–500 hours and extrapolate results to claim 25-year performance. This extrapolation is unreliable because degradation is not always linear over time.
Checklist for Reviewing UV Test Reports
| Check Item | What to Look For | Red Flag |
|---|---|---|
| Test standard referenced | ISO 4892-2, ASTM G154, or UL 746C | "Internal method" or no standard cited |
| Test duration | ≥720 hours | <720 hours or unspecified |
| Light source | Xenon arc or UV fluorescent | Unspecified or "sunlight equivalent" |
| Irradiance level | 60 W/m² (300–400 nm) for xenon | Not reported |
| Baseline data | Pre-exposure tensile and elongation | Missing or only post-exposure data |
| Property retention | Specific % values with tolerances | "Pass" without numerical data |
| Lab accreditation | ISO 17025 accredited lab | No lab name or accreditation number |
| Temperature/humidity control | Black panel temp 65±3°C, RH specified | No environmental parameters listed |
Why Combined Stressor Testing Matters
UV radiation in the real world never acts alone. Temperature cycling, humidity, salt spray (in coastal areas), and mechanical stress all accelerate degradation simultaneously. A UV test report that ignores temperature and humidity conditions during the test is incomplete. The best reports specify black panel temperature, chamber humidity, and spray cycle intervals.
IEA-PVPS research has documented that most premature PV cable failures involve synergistic degradation—UV plus heat plus moisture acting together. A report that only addresses UV in isolation underestimates real-world aging.
What to Do When You Find Red Flags
Don't immediately reject the supplier. Instead, request that they submit samples to a mutually agreed third-party lab (such as TUV, DEKRA, or Kiwa) for independent re-testing. If the supplier refuses, that itself is a significant red flag. Reputable manufacturers—ourselves included—welcome independent verification because it builds trust and supports long-term business relationships.
Can I trust lab-simulated aging tests to guarantee a 25-year service life for my project?
This is the question we hear most often from experienced EPC procurement teams in Europe. They know that no lab test perfectly replicates 25 years of real weather. But that doesn't mean lab tests are useless—it means you need to understand their limits.
Lab-simulated aging tests provide strong directional evidence of long-term UV performance but cannot guarantee a 25-year service life on their own. Combine accelerated test data with material formulation analysis, third-party certification, field performance records, and periodic on-site inspections for reliable life expectancy assessment.

The Gap Between Lab and Field
Accelerated weathering tests compress years of UV exposure into weeks or months. A 720-hour xenon arc test at 60 W/m² delivers roughly the equivalent UV dose of 1–2 years of outdoor exposure in central Europe. To simulate 25 years, you would need far longer test durations—or you must rely on acceleration factors that introduce uncertainty.
The fundamental problem is that degradation mechanisms change at different stages. Early degradation may be slow and linear. Later stages can involve sudden, rapid cracking as stabilizer reserves are depleted. Lab tests at 720–2000 hours may not capture these late-stage failure modes.
How Acceleration Factors Work
Researchers use the Arrhenius equation 9 and time-temperature superposition to estimate how lab hours translate to real-world years. But these models assume constant degradation kinetics, which is a simplification.
| Lab Test Duration | Approximate Real-World Equivalent (Central Europe) | Approximate Real-World Equivalent (Middle East/Desert) |
|---|---|---|
| 720 hours (xenon arc) | ~1.5–2 years | ~1–1.5 years |
| 1500 hours (xenon arc) | ~3–5 years | ~2–3 years |
| 2000 hours (xenon arc) | ~5–7 years | ~3–5 years |
| 5000 hours (xenon arc) | ~12–15 years | ~8–10 years |
These are approximations. The actual correlation depends on geographic location, installation angle, albedo effects from nearby surfaces, and whether cables are partially shaded or fully exposed.
Albedo: The Hidden UV Multiplier
Many installers overlook albedo—reflected UV from the ground, snow, water, or white rooftop membranes. A cable running across a white TPO roofing membrane can receive 60–80% more UV radiation than the same cable over dark asphalt. Desert sand reflects significant UV as well. If your project is in such an environment, standard 720-hour test data is even less sufficient. Push for 2000+ hour test results or select cables with higher-grade UV stabilizer packages.
Building a Multi-Layered Verification Approach
No single data point guarantees 25-year performance. The most reliable approach stacks multiple layers of evidence:
- Certified accelerated aging test results from a TUV or UL-accredited lab showing strong property retention after ≥720 hours.
- Material data sheet review confirming XLPO with adequate UV stabilizers (HALS, carbon black ≥2.5%).
- Field track record from the manufacturer showing installations in similar climates that are performing well after 5+ years.
- Periodic on-site inspection of installed cables—monthly visual checks and annual insulation resistance testing catch degradation early.
- Independent sample re-testing every 3–5 years from production batches to confirm manufacturing consistency.
Our production facility maintains a retention sample library. Every batch of cable produced is stored with full traceability. If a client reports a concern after three years, we can pull the original batch sample and compare it against newly manufactured cable and the field sample. This kind of traceability is what separates reliable manufacturers from those offering only paper promises.
The Role of Emerging Technologies
In 2025 and beyond, the industry is moving toward real-time monitoring. Embedded sensors in cable trays can track temperature and UV dose accumulation. Advanced imaging drones inspect cable routes for surface discoloration and cracking. These technologies don't replace lab testing—they complement it by providing continuous field validation.
For large-scale projects exceeding 100 MW, the cost of drone-based cable inspection is negligible compared to the cost of replacing degraded cables across an entire array. Consider including inspection provisions in your O&M contracts.
Conclusion
Verifying UV resistance data requires a layered approach: demand accredited third-party test reports, validate certificates online, scrutinize material formulations, and supplement lab data with field evidence and periodic inspections for true long-term confidence.
Footnotes
1. Provides a comprehensive overview of solar PV cables. ↩︎
2. Explains the European standard for photovoltaic cables. ↩︎
3. Details the international standard for xenon-arc weathering tests. ↩︎
4. Defines a key mechanical property in material testing. ↩︎
5. Provides access to the official TUV Rheinland certification database. ↩︎
6. Describes the properties and applications of XLPO insulation. ↩︎
7. Explains the role of carbon black in UV protection for plastics. ↩︎
8. Explains the principles and applications of FTIR spectroscopy. ↩︎
9. Provides context for accelerated aging calculations and limitations. ↩︎