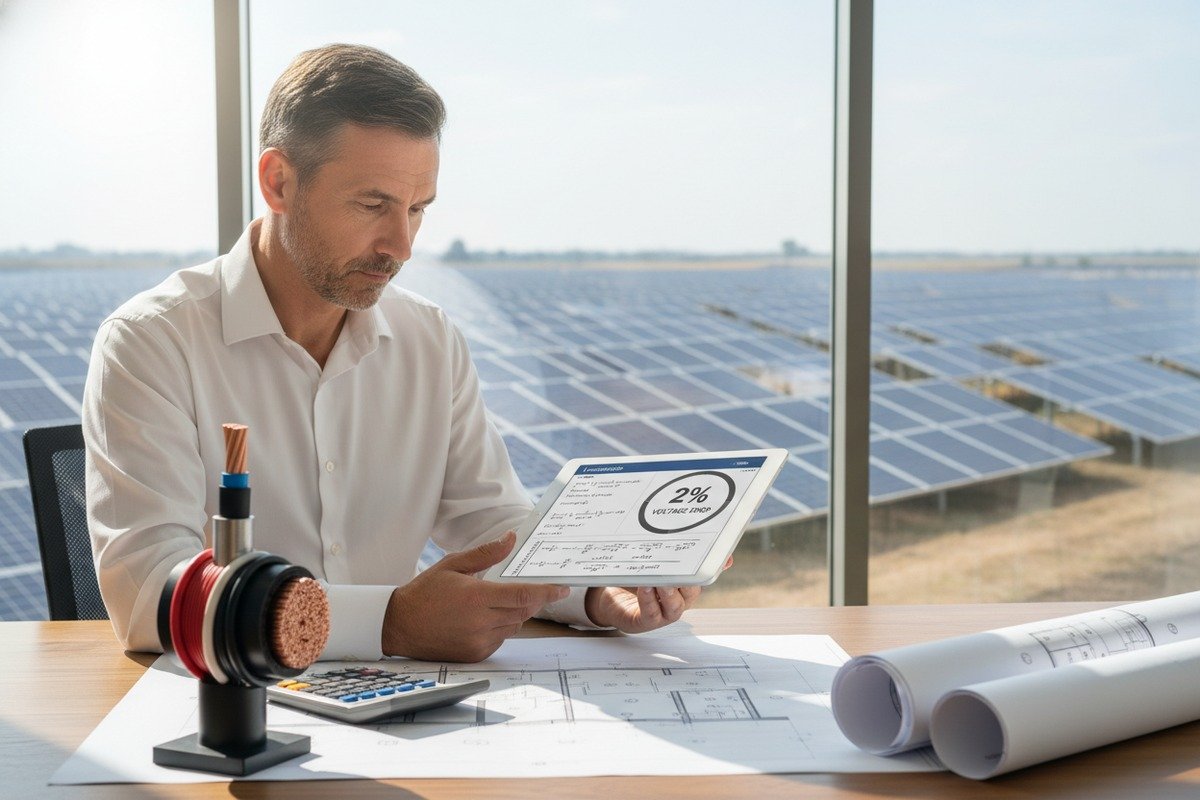
Every week, our engineering team fields calls from EPC buyers who discovered hidden power losses only after installation was complete NEC Chapter 9 Table 8 1. The cables looked fine. The connectors were tight. But the energy harvest numbers told a different story — 5%, 8%, sometimes 10% of generated power was simply vanishing in the wire before it ever reached the inverter. This is voltage drop 2, and when you are sourcing solar PV cables for large-scale projects, ignoring it during procurement is one of the most expensive mistakes you can make.
To calculate solar PV cable voltage drop for series strings, use the formula VD = (2 × L × R × I) / 1000, where L is the one-way cable length in feet, R is the conductor resistance per 1000 feet from NEC Chapter 9 Table 8, and I is the string's maximum power current (Imp). Then express the result as a percentage of total string voltage (Vstring = modules × Vmp), aiming for under 2–3%.
This guide walks you through every step — from the core formula to cable sizing, ROI impact, and what technical data to demand from your cable supplier before you commit to a bulk order. Let's dig in.
How do I calculate the specific voltage drop for my long-distance series string configurations?
When our factory ships H1Z2Z2-K cables 3 to solar farms in southern Spain or the Philippines, the first question we ask the buyer is: how long is your cable run, and how many modules per string? Without these two numbers, no one can tell you the right cable size.
To calculate voltage drop for a series string, multiply 2 × one-way cable length × conductor resistance × operating current, then divide by 1000. Compare the result to your total string voltage (modules × Vmp). Keep this percentage at or below 2–3% to protect system efficiency and stay within industry best practices.
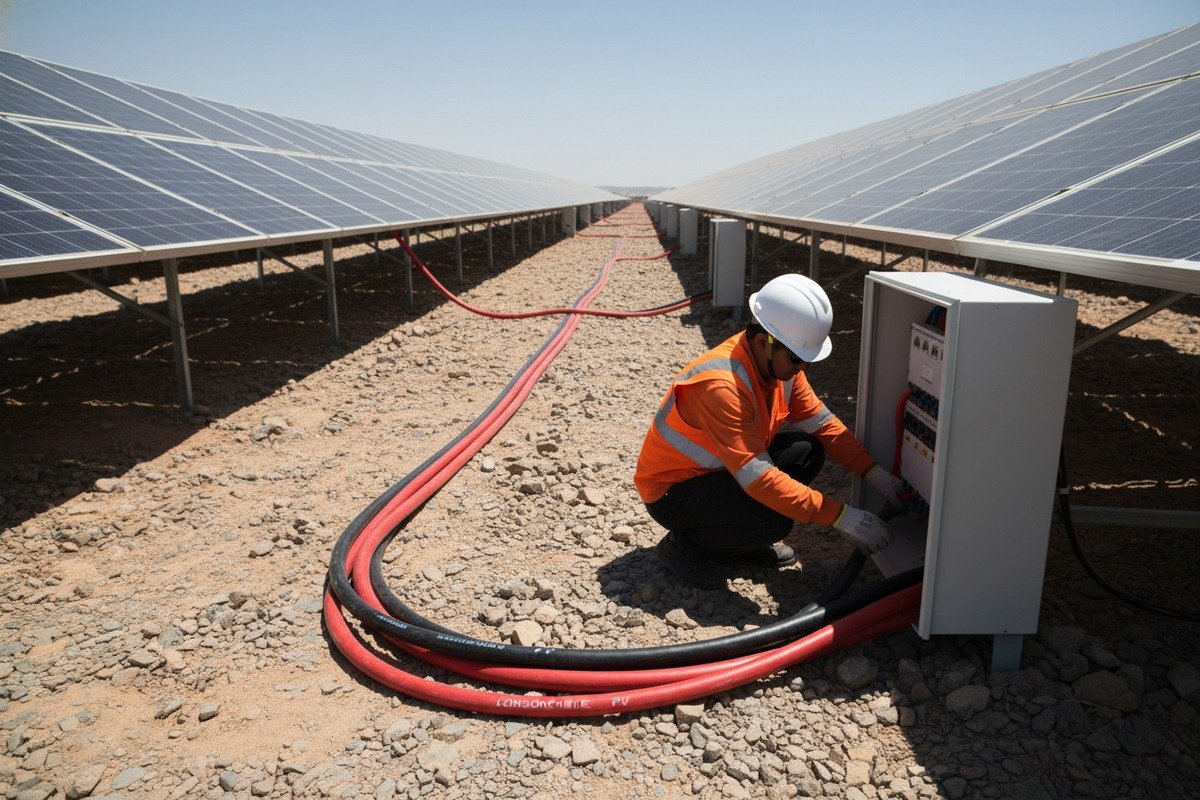
Understanding the Core Formula
The standard DC voltage drop formula is straightforward:
VD = (2 × L × R × I) / 1000
Here is what each variable means:
- VD = Voltage drop in volts
- L = One-way conductor length in feet (from panel string to combiner box or inverter)
- R = Conductor resistance in ohms per 1000 feet (from NEC Chapter 9, Table 8, at 75°C)
- I = Operating current 4 in amps (use Imp from the module datasheet for performance calculations)
The factor of 2 accounts for the full round-trip — positive and negative conductors.
To get the percentage:
VD% = (VD / Vstring) × 100
Where Vstring = number of modules in series × Vmp per module.
A Real-World Worked Example
Suppose you have a string of 12 modules. Each module has a Vmp of 37V and an Imp of 8.23A. The one-way cable run from the string to the combiner box is 150 feet. You are considering #14 AWG copper cable.
| Parameter | Value |
|---|---|
| Modules in series | 12 |
| Vmp per module | 37V |
| Vstring (total) | 444V |
| Imp (operating current) | 8.23A |
| One-way length (L) | 150 ft |
| Conductor resistance (#14 AWG Cu, 75°C) | 3.14 Ω/kft |
Step 1: VD = (2 × 150 × 3.14 × 8.23) / 1000 = 7.75V
Step 2: VD% = (7.75 / 444) × 100 = 1.75%
That is within the 2% target. But if your run were 200 feet, the drop climbs to 2.33% — and you would want to consider upgrading to #12 AWG.
Why "2 × L" Matters
Some installers mistakenly use only the one-way length. This underestimates the actual drop by half. Current must travel from the string to the combiner and return through the negative conductor. Both legs have resistance. Always use the round-trip distance.
Imp vs. Isc: Which Current Should You Use?
For voltage drop calculations focused on performance and energy yield, use Imp — the current at maximum power point. For ampacity and overcurrent protection 5 sizing, NEC requires Isc × 1.25. Using Isc × 1.25 for voltage drop calculations leads to oversized cables and unnecessary cost. Our technical team always clarifies this distinction for buyers during the quoting stage, because it directly affects wire gauge selection and your project budget.
Temperature Adjustments
Module Vmp changes with temperature. On a hot day, Vmp drops. On a cold day, it rises. For worst-case voltage drop analysis, use the Vmp at maximum operating temperature (not STC). This gives you the lowest string voltage — and the highest percentage drop. Many designers use ASHRAE 2% design temperatures for their site location.
Which cable cross-section should I choose to ensure my system power loss stays within the 1-3% limit?
Over the past 30 years, our production lines have manufactured solar cables in cross-sections ranging from 2.5 mm² all the way to 120 mm². The most common mistake we see from procurement teams is selecting cable size based solely on ampacity tables — without ever checking the voltage drop percentage for their specific run length.
Choose a cable cross-section by first calculating the voltage drop at your actual run length and string current, then selecting the smallest gauge that keeps the drop within 1–3%. For most PV source circuits under 100 meters, 4 mm² or 6 mm² copper cables meet the target. Longer runs or higher currents require 10 mm² or larger.
The Iterative Selection Process
Cable sizing for voltage drop is an iterative process. You pick a trial size, calculate the drop, and adjust up or down. Here is a practical comparison for a common scenario:
Scenario: 15-module string, Vmp = 38V per module (Vstring = 570V), Imp = 10A, one-way run = 80 meters (262 feet).
| Cable Cross-Section 6 (mm²) | AWG Equivalent | Resistance (Ω/km at 75°C) | VD (Volts) | VD% of 570V |
|---|---|---|---|---|
| 2.5 mm² | ~14 AWG | 8.87 | 37.1 | 6.51% |
| 4 mm² | ~12 AWG | 5.52 | 23.1 | 4.05% |
| 6 mm² | ~10 AWG | 3.69 | 15.4 | 2.71% |
| 10 mm² | ~8 AWG | 2.19 | 9.2 | 1.61% |
| 16 mm² | ~6 AWG | 1.38 | 5.8 | 1.01% |
From this table, 6 mm² keeps you just under the 3% threshold, while 10 mm² brings you comfortably within the 2% industry ideal. The choice depends on your project's loss tolerance and budget.
Copper vs. Aluminum: A Cost-Resistance Trade-Off
Aluminum conductors 7 cost less per meter but have roughly 60% higher resistance than copper of the same cross-section. For long runs where voltage drop is already borderline, aluminum requires significant upsizing — often from 6 mm² Cu to 10 mm² Al — which can erase the cost savings.
| Conductor Material | Resistance at 6 mm² (Ω/km, 75°C) | Equivalent Al Size for Same R | Cost Comparison |
|---|---|---|---|
| Copper | 3.69 | — | Baseline |
| Aluminum | 5.87 | ~10 mm² Al ≈ 3.54 Ω/km | 15–25% lower per meter, but more material needed |
For projects in Europe where H1Z2Z2-K or EN 50618 compliance is mandatory, our customers typically prefer copper for source circuits under 50 meters. For ground-mount farms with 100+ meter runs, aluminum becomes viable — but only if the voltage drop is verified at the larger cross-section.
The "Series String as a Secret Weapon" Strategy
Here is something many buyers overlook: adding more modules in series raises Vstring without changing Imp. This directly reduces VD% because the denominator in your percentage calculation gets bigger.
For example, going from 10 modules (370V string) to 15 modules (570V string) with the same cable and current drops your VD% from 4.17% to 2.71% — without changing the wire at all. Of course, you must verify the string voltage stays within your inverter's MPPT range. Modern string inverters often accept 200V–1000V or even up to 1500V, giving you plenty of room to optimize.
Practical Rule of Thumb
For runs under 30 meters, 4 mm² copper handles most residential and small commercial strings. For 30–80 meter runs, 6 mm² is your starting point. Beyond 80 meters, calculate carefully and expect to use 10 mm² or 16 mm². These rules apply to typical Imp values of 8–12A. Higher-current strings from bifacial or large-format modules need individual calculation.
How does the voltage drop in my PV cables impact the long-term ROI and efficiency of my solar farm?
During a recent factory visit from a German EPC client, their project engineer showed us a spreadsheet comparing two cable quotes. The cheaper option saved €12,000 upfront — but over 25 years, the extra 1.5% voltage drop would cost the project over €85,000 in lost energy revenue. That conversation changed their entire procurement strategy.
Every 1% of voltage drop translates roughly to a 1% reduction in delivered power, compounding over the system's 25–30 year lifespan. A solar farm with 3% cable losses instead of 1.5% can lose tens of thousands of euros in cumulative revenue, making cable quality and sizing one of the highest-leverage investment decisions in PV project economics.
Power Loss Is Not Just Voltage — It Is Money
Voltage drop is directly proportional to power loss. If your string produces 5 kW and the cable causes a 2% voltage drop, you lose 100W continuously at peak production. Over a year in a location with 1,500 peak sun hours, that is 150 kWh per string. Multiply by 200 strings on a commercial farm, and you are looking at 30,000 kWh of lost production — every single year.
At a feed-in tariff or PPA rate of €0.08/kWh, that is €2,400/year. Over 25 years, that is €60,000 in lost revenue from just one percentage point of excess voltage drop.
The Compounding Effect on LCOE
Levelized Cost of Energy 8 (LCOE) measures the total cost of a solar project divided by total energy produced over its lifetime. Cable losses directly reduce the denominator. A 1% increase in cable losses can raise your LCOE by 1–1.5%, which in competitive utility-scale tenders can mean losing the bid entirely.
Inverter Efficiency and MPPT Interaction
Voltage drop does not just reduce power — it can push the string voltage below the inverter's optimal MPPT window 9. Most inverters track maximum power between a defined voltage range. If cable losses drop the arriving voltage near the low end of this range, especially during hot afternoons when Vmp is already reduced by temperature, the inverter may derate or shut down entirely.
We have seen cases where a 3% cable drop combined with a 5% temperature-induced Vmp reduction caused the string voltage to fall below the inverter's minimum MPPT threshold — resulting in zero output during the hottest hours of the day. This is a scenario that proper cable sizing completely prevents.
Bifacial Module Considerations
Bifacial panels can produce 10–20% more current under high-albedo conditions (white gravel, snow). This higher-than-nameplate current increases I²R losses in the cable. If your voltage drop calculation used only the front-side Imp, you may exceed your target drop during peak bifacial gain. Our recommendation: use the bifacial Imp (often stated as Imp × bifacial factor) for your cable sizing when these modules are specified.
The Bottom Line for Procurement
Spending an extra €2–5 per meter on the correct cable gauge is not a cost — it is an investment with a measurable payback period, often under 3 years. When our clients ask us for cable recommendations, we always run the voltage drop calculation alongside the quote. It takes five minutes and can save a project hundreds of thousands over its lifetime.
What technical data should I request from my manufacturer to verify voltage drop performance before I place a bulk order?
We have had buyers arrive at our Hainan facility with nothing more than a cable length and a module brand name. That is not enough. Before signing a purchase order for thousands of meters of PV cable, you need specific, verifiable data points — and you need to know what to do with them.
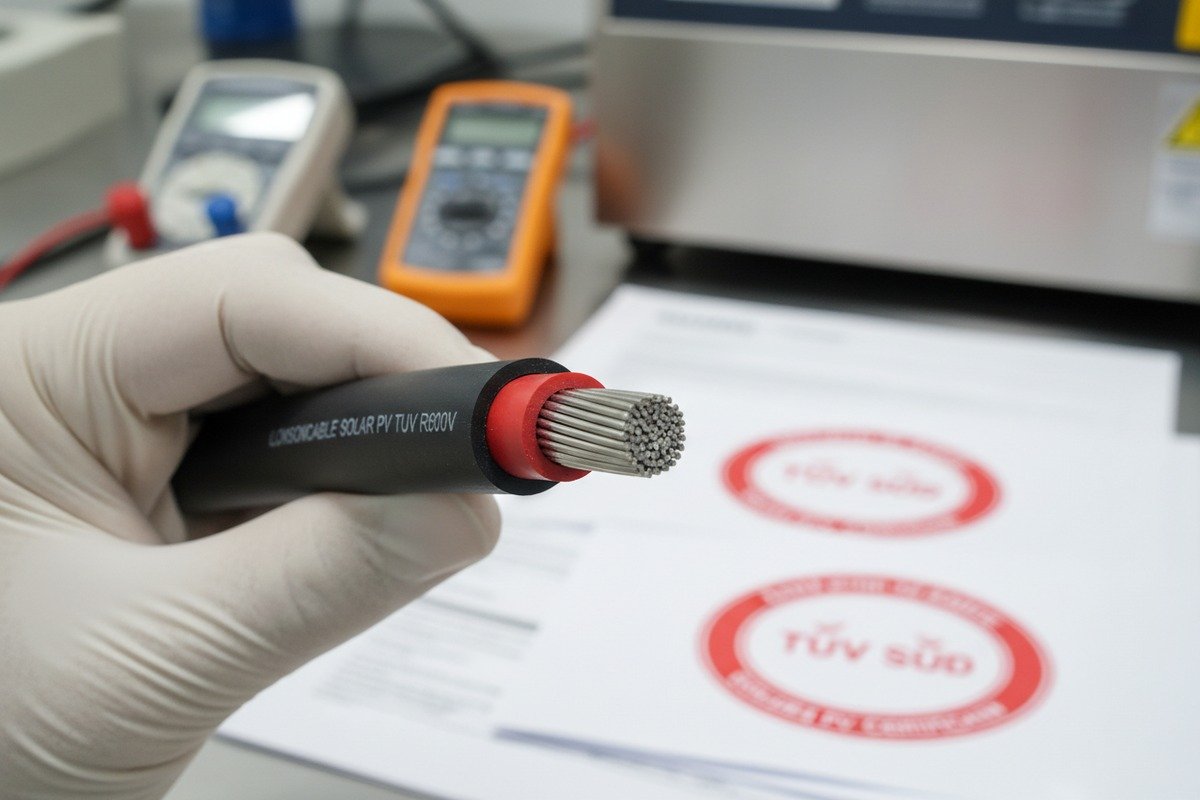
Before placing a bulk cable order, request the conductor resistance per unit length (Ω/km at 20°C and 75°C), exact cross-sectional area, conductor material and class, insulation type, temperature ratings, and third-party test certificates (TUV, UL, or equivalent). Use these values in your voltage drop formula to independently verify the supplier's claims match your project requirements.
The Essential Data Checklist
Here is exactly what to ask for — and why each item matters for voltage drop verification:
| Data Point | Why It Matters for Voltage Drop | What to Watch For |
|---|---|---|
| Conductor resistance (Ω/km at 20°C) | Core input for your VD formula | Must match IEC 60228 10 or NEC Ch. 9 Table 8 values for the stated cross-section |
| Conductor resistance (Ω/km at 75°C) | Realistic operating temperature value | Should be ~20% higher than 20°C value for copper |
| Actual cross-sectional area (mm²) | Confirms the cable is truly the stated size | Some low-cost suppliers undersize by 5–10%, increasing resistance |
| Conductor material and class | Copper (Class 5 flexible) vs. aluminum | Class 5 stranded copper is standard for PV; tinned copper adds corrosion resistance |
| Insulation material and thickness | Affects temperature rating and longevity | XLPO or XLPE for H1Z2Z2-K; must withstand 120°C continuous for TUV 2PFG 1169 |
| Third-party test certificates | Independent verification | TUV, UL 4703, or CSA marks — request the actual certificate number and verify online |
| Temperature derating factors | Adjusts resistance for your site conditions | Needed if ambient temps exceed 40°C or cables are bundled |
How to Cross-Check Resistance Values
Take the manufacturer's stated resistance at 20°C and convert to your operating temperature:
R(T) = R(20°C) × [1 + α × (T - 20)]
Where α = 0.00393 for copper and 0.00403 for aluminum.
For copper at 75°C: R(75°C) = R(20°C) × [1 + 0.00393 × 55] = R(20°C) × 1.216
If the manufacturer's 75°C value does not match this calculation within 2–3%, ask questions.
Beware of Undersized Conductors
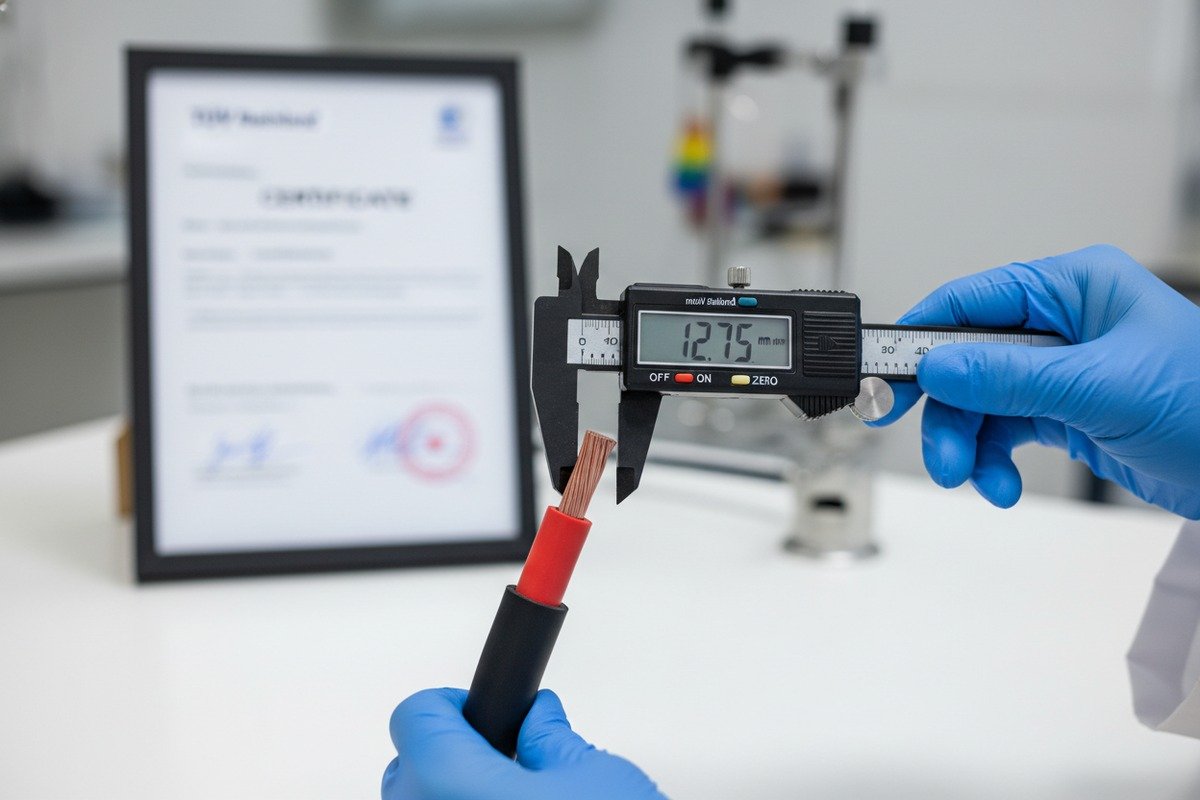
One of the most serious quality issues we see in the market is undersized conductors. A cable labeled "6 mm²" may actually contain only 5.2 mm² of copper. This increases resistance by roughly 15% and pushes your voltage drop beyond the calculated target.
How to verify: request a mill certificate showing the actual conductor weight per meter. For Class 5 stranded copper at 6 mm², the conductor weight should be approximately 53.5 g/m (±2%). If it is significantly lighter, the cross-section is likely undersized.
At our facility, every production batch undergoes resistance testing per IEC 60228, and we include the test report with shipment. We also welcome third-party inspection (SGS, Bureau Veritas) at the factory before shipping — something we actively encourage for orders above 50 km.
Certification Verification
Do not accept a photocopy of a TUV or UL certificate. Every legitimate certificate has a unique number that can be verified on the certifying body's website. For TUV-certified H1Z2Z2-K cables, check the TUV Rheinland Certipedia database. For UL 4703 solar cables, search the UL Product iQ database. If the certificate number does not return a valid result, walk away.
Packaging and Delivery Considerations
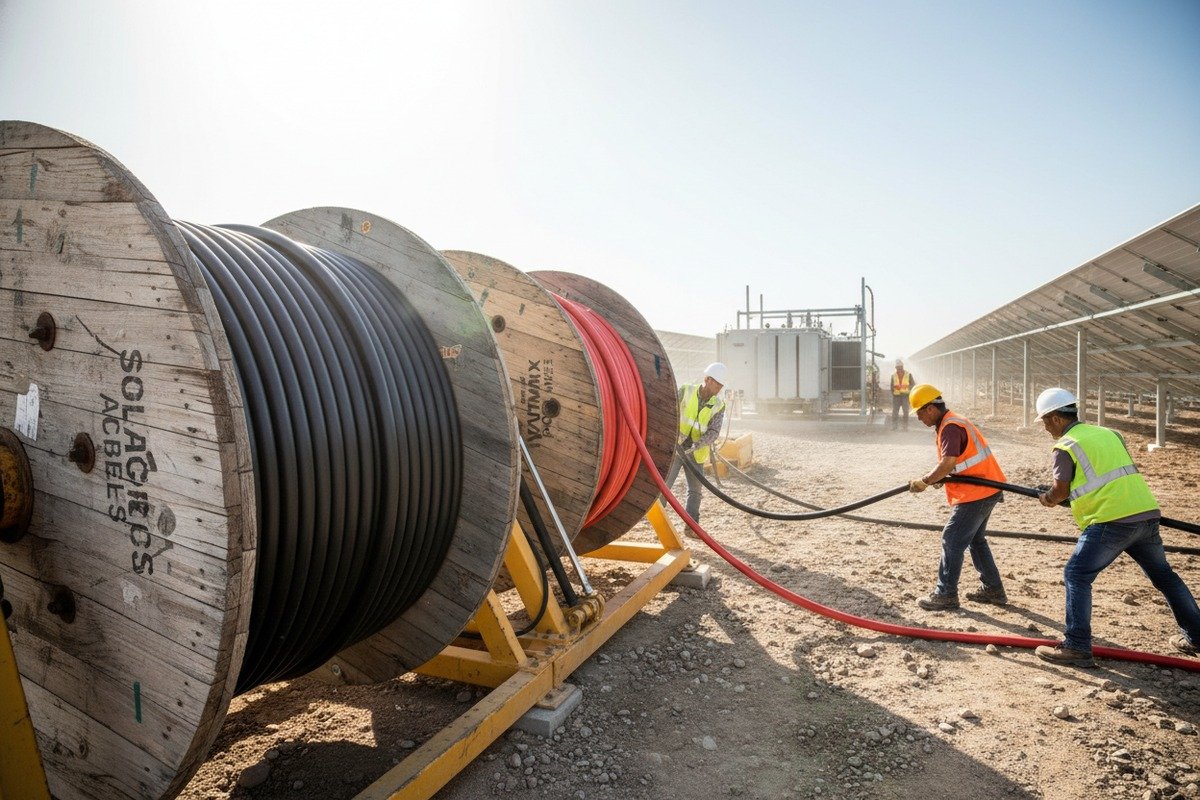
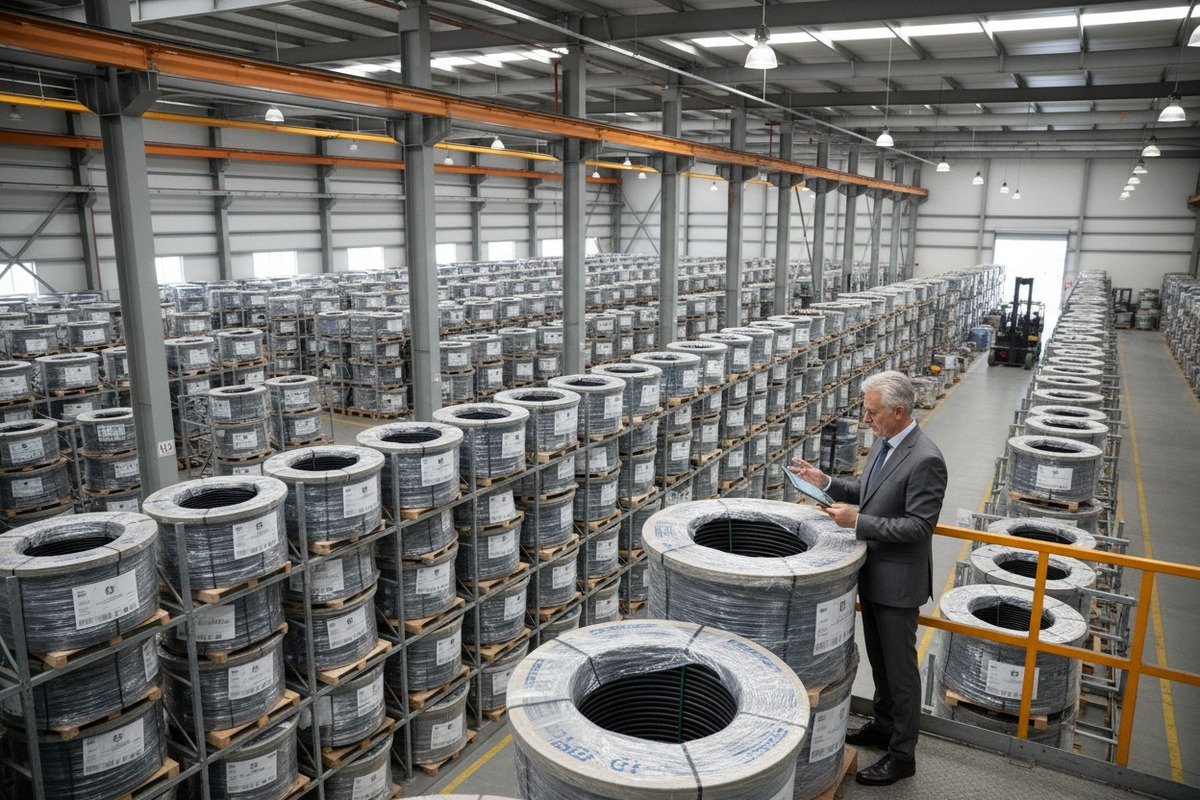
This may seem unrelated to voltage drop, but damaged cables have compromised insulation and potentially nicked conductors — both of which increase localized resistance and create hot spots. We ship on heavy-duty wooden drums rated for ocean freight, with each drum clearly labeled with batch number, length, and test results. Proper packaging protects the electrical performance you paid for.
Conclusion
Voltage drop is not a theoretical concern — it is a direct, measurable drain on your solar investment. Calculate it before you source. Size your cables correctly. And demand the technical data that lets you verify performance independently. Your project's 25-year return depends on it.
Footnotes
1. Provides direct reference to conductor properties in the National Electrical Code. ↩︎
2. Explains voltage drop as reduction in voltage due to resistance. ↩︎
3. Describes the specifications and application of H1Z2Z2-K solar cables. ↩︎
4. Explains the concept of operating current (Imp) in solar panels. ↩︎
5. Comprehensive and authoritative article on conductor sizing, ampacity, and overcurrent protection. ↩︎
6. Defines cable cross-section and its importance in electrical engineering. ↩︎
7. Compares the properties and applications of aluminum and copper conductors. ↩︎
8. Explains the definition and calculation of Levelized Cost of Energy (LCOE). ↩︎
9. Describes the function of MPPT inverters and their optimal operating range. ↩︎
10. Provides information on the international standard for conductors of insulated cables. ↩︎